Generate Synthetic Data for the Parameter-Profiles Example#
Produces the data.csv / energy.csv / time.csv / aux_axis.csv used by
../example.ipynb.
The data mimics time-resolved XPS of a semiconductor core level: a single GLP
peak on a flat background, measured as a depth average. XPS is surface
sensitive, so each depth layer contributes with an exponential IMFP weight,
and band bending shifts the peak position linearly with depth. After
photoexcitation at t = 0, a surface photovoltage collapses the band bending to
flat-band condition; it recovers exponentially over ~100 ps.
Ground truth model
Offset+GLPpeak — seemodels_energy_truth.yamlDepth profiles (
models_profile_truth.yaml): IMFP weighting onGLP_01_A(pExpDecay), band bending shift onGLP_01_x0(pLinear)Time dependence on the band bending gradient
GLP_01_x0_pLinear_01_m:BandBendingRecovery— seemodels_time_truth.yaml
Re-run this notebook to regenerate the data in place.
from pathlib import Path

import matplotlib.pyplot as plt
import numpy as np
import trspecfit
1. Define the Ground Truth Model#
Build the truth model on the same axes the example fits over. The
*_truth.yaml files hold the ground truth parameters. The two profiles attach
to the GLP parameters; the dynamics attaches to the profile’s gradient
parameter, so the depth profile re-shapes at every time step (spectral
diffusion).
project = trspecfit.Project(path=Path.cwd(), config_file=None)

# Save the axes first and reload them, so the simulation runs on bit-identical
# axes to what ../example.ipynb later loads (CSV rounding would otherwise
# introduce tiny axis differences between generation and fitting).
data_fmt = '%.6e'
np.savetxt('energy.csv', np.arange(95, 102, 0.025), fmt=data_fmt)  # 280 points (eV)
np.savetxt('time.csv', np.arange(-50, 300, 2), fmt=data_fmt)       # 175 points (ps)
np.savetxt('aux_axis.csv', np.arange(0, 10, 0.2), fmt=data_fmt)    # 50 points (nm)
energy = np.loadtxt('energy.csv')
time = np.loadtxt('time.csv')
depth = np.loadtxt('aux_axis.csv')

file = trspecfit.File(
    parent_project=project,
    energy=energy,
    time=time,
    aux_axis=depth,
)

# Load the ground truth energy model, attach the two depth profiles, and make
# the band bending gradient time-dependent.
file.load_model(model_yaml='models_energy_truth.yaml', model_info='truth')
file.add_par_profile(
    target_model='truth',
    target_parameter='GLP_01_A',
    profile_yaml='models_profile_truth.yaml',
    profile_model='IMFP',
)
file.add_par_profile(
    target_model='truth',
    target_parameter='GLP_01_x0',
    profile_yaml='models_profile_truth.yaml',
    profile_model='BandBending',
)
file.add_time_dependence(
    target_model='truth',
    target_parameter='GLP_01_x0_pLinear_01_m',
    dynamics_yaml='models_time_truth.yaml',
    dynamics_model='BandBendingRecovery',
)

file.describe_model()
Loading model to describe energy- (and time-)dependent data: truth
Loading profile model for parameter: GLP_01_A of IMFP model
Loading profile model for parameter: GLP_01_x0 of BandBending model
Loading model to describe time-dependence of a model parameter: GLP_01_x0_pLinear_01_m of BandBendingRecovery model
model name: truth
function: Offset from trspecfit.functions.energy
function: GLP from trspecfit.functions.energy
all lmfit.Parameters() [flattened and sorted alphabetically]:
Name                                     Value      Min      Max   Stderr     Vary     Expr Brute_Step
GLP_01_A                                     0     -inf      inf     None    False     None     None
GLP_01_A_pExpDecay_01_A                    100     -inf      inf     None     True     None     None
GLP_01_A_pExpDecay_01_tau                    2     -inf      inf     None     True     None     None
GLP_01_F                                   1.2     -inf      inf     None     True     None     None
GLP_01_m                                   0.3     -inf      inf     None     True     None     None
GLP_01_x0                                 99.5     -inf      inf     None     True     None     None
GLP_01_x0_pLinear_01_b                       0     -inf      inf     None    False     None     None
GLP_01_x0_pLinear_01_m                    -0.5     -inf      inf     None     True     None     None
GLP_01_x0_pLinear_01_m_expFun_01_A         0.5     -inf      inf     None     True     None     None
GLP_01_x0_pLinear_01_m_expFun_01_t0          0     -inf      inf     None     True     None     None
GLP_01_x0_pLinear_01_m_expFun_01_tau       100     -inf      inf     None     True     None     None
GLP_01_x0_pLinear_01_m_gaussCONV_SD         10    1e-06      100     None     True     None     None
Offset_y0                                  0.5     -inf      inf     None     True     None     None
2. Simulate and Save#
Photon-counting detection draws each pixel from a Poisson distribution, so the
noise is signal-dependent (shot noise) — the realistic regime for counting
detectors. Lower counts_per_delay ⇒ noisier data.
sim = trspecfit.Simulator(
    model=file.model_active,
    detection='photon_counting',
    counts_per_delay=20000,
    seed=42,
)
clean, noisy, noise = sim.simulate_2d()

# Save noisy data (data is [time, energy], matching File's expectation).
# The axes were already saved (and reloaded) above.
np.savetxt('data.csv', noisy, delimiter=',', fmt=data_fmt)

snr = clean.max() / np.std(noise)
print(f'data.csv  |  shape {noisy.shape}  |  peak SNR ~ {snr:.1f}')
data.csv | shape (175, 280) | peak SNR ~ 40.4
3. Quick Visual Check#
In the 2D map, look at t = 0: the peak jumps toward higher binding energy, grows, and sharpens — at flat-band condition all depth layers line up at the surface binding energy — then relaxes back over ~100 ps. The 1D slices compare the equilibrium line shape (broadened and skewed by band bending) with the near-flat-band one.
fig, axes = plt.subplots(1, 2, figsize=(10, 4))

im = axes[0].pcolormesh(energy, time, noisy, shading='auto')
axes[0].set_xlabel('Binding energy (eV)')
axes[0].set_ylabel('Time (ps)')
axes[0].set_title('Simulated 2D data')
axes[0].invert_xaxis()  # XPS convention: high binding energy on the left
plt.colorbar(im, ax=axes[0])

t_ind = np.abs(time - 10).argmin()
axes[1].plot(energy, noisy[t_ind], lw=0.8, label='noisy (t = 10 ps)')
axes[1].plot(energy, clean[t_ind], lw=2.0, label='clean (t = 10 ps)')
axes[1].plot(energy, clean[:10].mean(axis=0), lw=2.0, ls='--',
             label='clean (equilibrium)')
axes[1].set_xlabel('Binding energy (eV)')
axes[1].set_ylabel('Intensity')
axes[1].set_title('Near-flat-band vs equilibrium line shape')
axes[1].invert_xaxis()
axes[1].legend()

plt.tight_layout()
plt.show()
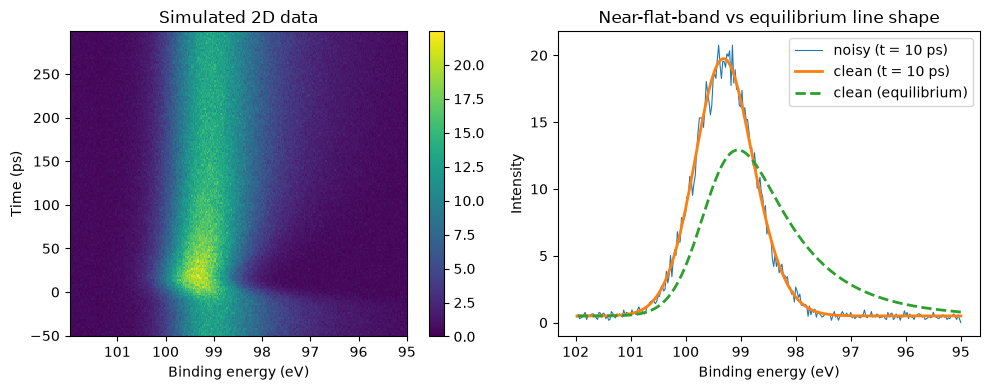
Ground Truth Parameters#
Parameter |
Value |
Description |
|---|---|---|
|
0.5 |
Flat background |
|
0 (fixed) |
Amplitude comes entirely from the IMFP profile |
|
99.5 eV |
Surface binding energy |
|
1.2 eV |
Peak FWHM |
|
0.3 |
Gaussian/Lorentzian mixing |
|
100 |
Surface spectral weight (IMFP profile) |
|
2.0 nm |
IMFP — fixed in the fits, known from tables |
|
−0.5 eV/nm |
Equilibrium band bending gradient |
|
0 |
Profile is a pure shift relative to |
|
10 ps |
IRF width |
|
+0.5 eV/nm |
Photovoltage collapse (flat-band at t = 0) |
|
100 ps |
Band bending recovery time constant |
Model files#
The YAML files next to this notebook, as shipped with the example.
models_energy_truth.yaml#
# ground truth energy model for data generation
# (same structure as the profile-aware fit models in ../models_energy.yaml)

# Single core-level peak on a flat background. A is 0 because the IMFP depth
# profile (data/models_profile_truth.yaml) provides the full amplitude;
# x0 is the *surface* binding energy — the band bending profile adds the
# depth-dependent shift.
truth:
    Offset:
        y0: [0.5, True]
    GLP:
        A: [0, False]
        x0: [99.5, True]
        F: [1.2, True]
        m: [0.3, True]
models_profile_truth.yaml#
# ground truth profile models for data generation
# Both profiles are evaluated over the depth axis (data/aux_axis.csv, nm)
# and the spectra are averaged uniformly over that axis.

# IMFP weighting, attached to GLP_01_A:
# signal from depth z contributes with weight A * exp(-z / tau),
# where tau is the inelastic mean free path (IMFP).
IMFP:
    pExpDecay:
        A: [100, True]
        tau: [2.0, True]

# Band bending, attached to GLP_01_x0:
# the core level shifts linearly with depth, x0(z) = x0_surface + m * z.
# m < 0: higher binding energy at the surface (upward band bending).
BandBending:
    pLinear:
        m: [-0.5, True]
        b: [0, False]
models_time_truth.yaml#
# ground truth time model for data generation
# Attached to the band bending gradient GLP_01_x0_pLinear_01_m — a parameter
# of the *profile* model, not of the energy model (spectral diffusion).

# Photoexcitation creates a surface photovoltage that collapses the
# equilibrium band bending (m jumps by +A, i.e. less negative), then recovers
# exponentially with time constant tau. The step is blurred by a Gaussian IRF.
# A = 0.5 exactly cancels the equilibrium gradient m = -0.5 at t = 0:
# the bands are driven all the way to flat-band condition (SPV saturation).
BandBendingRecovery:
    gaussCONV:
        SD: [10, True, 1.0E-6, 100]
    expFun:
        A: [0.5, True]
        tau: [100, True]
        t0: [0, True]